Tuesday, August 13, 2013

NSA “touches” more of Internet than Google / In deep packet inspection, it's not the size of the data that matters.

NSA “touches” more of Internet than Google

In deep packet inspection, it's not the size of the data that matters.

Equinix's co-location facility in San Jose, California, one of the network exchange sites likely tapped by the NSA's "one-side foreign" surveillance.
Photo: Peter McCollough/Wired.com
In a memo issued last Friday, the National Security Agency (NSA) provided details of its ongoing network surveillance operations intended to assuage concerns about its scope, content, and oversight. As Ars' Cyrus Farivar reported, the NSA tried to set the context of its activities with a Carl Sagan-like metaphor:
According to figures published by a major tech provider, the Internet carries 1,826 Petabytes of information per day. In its foreign intelligence mission, NSA touches about 1.6 percent of that. However, of the 1.6 percent of the data, only 0.025 percent is actually selected for review. The net effect is that NSA analysts look at 0.00004 percent of the world's traffic in conducting their mission—that's less than one part in a million. Put another way, if a standard basketball court represented the global communications environment, NSA's total collection would be represented by an area smaller than a dime on that basketball court.
The numbers are no real surprise—we've already discussed how the laws of physics would make it impossible for the NSA to capture everything, or even a significant portion of everything, that passes over the Internet. But they're also misleading. In the world of deep packet inspection, verbs like "touch," "select," "collect," and "look at" don't begin to adequately describe what is going on or what information is extracted from traffic in the process. Considering all that's within what flows across the Internet, 1.6 percent could hold a significant portion of the metadata describing person-to-person communications.

How much is 1.6 percent?

The dime on the basketball court, as the NSA describes it, is still 29.21 petabytes of data a day. That means the NSA is "touching" more data than Google processes every day (a mere 20 petabytes).

While 29.21 petabytes is a fraction of the overall traffic on the Internet, it is the equivalent of the traffic that passes through several major Internet exchanges each day. It amounts roughly to 2.77 terabits per second—more than the average throughput of the Equinix exchange network, the CoreSite Any2 ExchangeNew York International Internet Exchange (NYIIX), and Seattle Internet Exchange (SIX) combined. In other words, the 1.6 percent of the total of Internet traffic "touched" by the NSA could easily contain much of the traffic passing through the US' core networks. It can certainly include all the traffic inbound from and outbound to other nations.

Those exchanges are likely the primary targets of the NSA's Special Source Operations "one-end foreign" (1EF) network tap operations. The remaining sources are overseas taps, including "FORNSAT" satellite communications intercepts and data shared by friendly foreign governments' own network surveillance—such as Germany's foreign intelligence agency, the Bundesnachrichtendienst (BND), as detailed in a report published today by Der Spiegel. There are also covert sites set up by the NSA's Special Collections Service, likely including targeted taps of networks in even "friendly" countries.

The NSA has approximately 150 XKeyscore collection points worldwide. To reach 29.21 petabytes per day, XKeyscore sites pull in around 190 terabytes a day. And to keep the three-day "buffer" XKeyscore holds of captured traffic, that would mean the sites have an average of about 600 terabytes of storage—the equivalent of a fairly manageable 150 4-TB drives.

Pick a peck of packets

Regardless how much data flows through the NSA's tap points, all of it is getting checked. While the NSA may "touch" only 29.21 petabytes of data a day, it runs its digital fingers through everything that flows through the tap points to do so.

The NSA's XKeyscore uses packet analyzers, the hardware plugged into the network that diverted Internet data is routed down, to look at the contents of network traffic as it passes by. The packet analyzers use a set of rules to check each packet they "see" as it is read by the analyzers' software into memory.

Packets that don't meet any of the rules that have been configured are sent along unmolested. In a "normal" network filtering situation, these packets would then be forwarded down the wire to their recipient, but in the NSA's case the packets are just clones of the packets that have already passed onto their intended destination. They are just sent to /dev/null—flushed away forever.

Packets that match one or more of the rules get routed to processing servers for further analysis. Those rules can be very broad—"grab everything with an IP address in its header that is outside the United States," for example—or they can look for very specific patterns within packets, such as those of VPN and website log-ins, Skype and VoIP traffic, or e-mails with attachments. In some cases, a filter may capture only the initial three-part TCP handshake of a connection between two systems, or it may only look for specific patterns of Web requests from clients. The rules could also include "if-then-else" logic: "If this is a packet that is part of an e-mail message I saw going by earlier and it includes attachment data, then grab it."
Enlarge / 
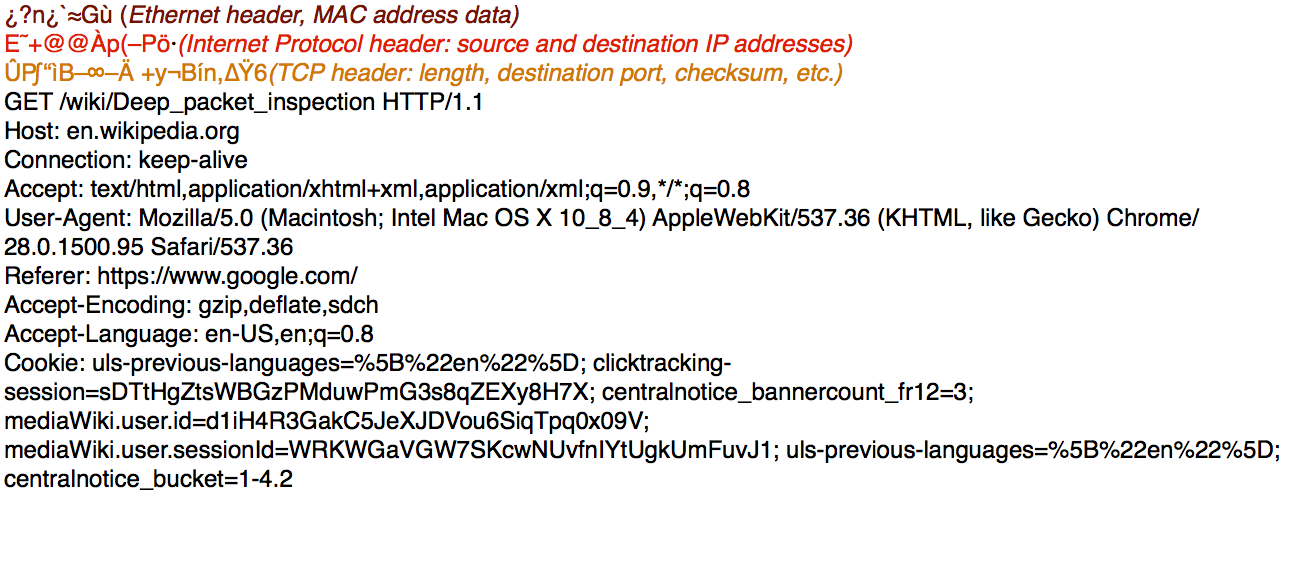
A single IP packet, snatched from the stream, can tell a lot. This HTTP request tells anyone who reads it where I am, what I'm looking for, where on the Web I'm coming from, and a collection of cookies that can be used to track me later.
Sean Gallagher
As a result, if properly tuned, the packet analyzer gear at the front-end of XKeyscore (and other deep packet inspection systems) can pick out a very small fraction of the actual packets sent over the wire while still extracting a great deal of information (or metadata) about who is sending what to whom. This leaves disk space for "full log data" on connections of particular interest.

How I learned to stop worrying and love packet capture

There's a lot of chaff that gets ignored by XKeyscore sites. They ignore Web server responses, DNS traffic, content distribution network traffic, and the other administrivia and overhead that is involved in making the Internet work. At least in theory, they largely ignore domestic Internet traffic that doesn't transit outside the US. Though depending on where you live in the US and where you're connecting to, a significant portion of your network traffic may pass through Canada or follow other paths that could expose you to surveillance.
And, at least up until this point, all of the processing is being done without human intervention or human eyeballs being involved. The data is kept in buffer for three days and heavily indexed for search, with metadata extracted and held for a month. Still, unless the content matches a cross-referenced search like "all Excel documents e-mailed in Iraq," it will probably avoid human eyes.

XKeyscore is also integrated into Marina, the NSA's phone call metadata database.  That allows for the trolling of Internet traffic for phone numbers of interest and for quick searches of raw data in XKeyscore's cache by analysts.

After XKeyscore's processing servers churn through the raw captured data, they forward extracted information such as metadata, attachments, and other content related to cases assigned a National Intelligence identifier over the wire to PINWALE, the NSA's in-house "big data" analysis platform for Internet intercepts (believed to be based on the Accumulo data analysis engine). This has to be done with a good deal of care not to overwhelm the NSA's private network backhaul to its data centers and reduce the performance of XKeyscore searches. So by the time the data has gone through this many levels of refinement, the NSA says that only 0.025 percent of the data  "touched" by its systems each day is "selected for review" and sent back.

That's 7.47 terabytes a day of connection metadata, cyber-attack targeting data and virtual private network intercepts, e-mail attachments, and instant messages. Really, that's nothing, right? The 2.66 petabytes a year of analytics that get rolled up in front of the eyeballs of analysts at NSA, in the DOD, and various other intelligence and law enforcement agencies is but a pittance.

Of course, that doesn't cover the fact that the NSA is, in effect, collecting 10.411 exabytes of short-term searchable content in XKeyscore. They extract information from it that is much more valuable (and potentially more intrusive) than the raw data.
Sean Gallagher / Sean is Ars Technica's IT Editor. A former Navy officer, systems administrator, and network systems integrator with 20 years of IT journalism experience, he lives and works in Baltimore, Maryland.

Tuesday, August 6, 2013

Innovation Insight: File Analysis Innovation Delivers an Understanding of Unstructured Dark Data

Innovation Insight: File Analysis Innovation Delivers an Understanding of Unstructured Dark Data

28 March 2013 ID:G00250750
Analyst(s): Alan Dayley

VIEW SUMMARY

Explosive, unstructured data growth is forcing IT leaders to rethink data management. IT, data and storage managers use file analysis to deliver insight into information about the data, enabling better management and governance to improve business value, reduce risk and lower management cost.

Overview

Key Findings

  • Unstructured data growth is rapidly outpacing structured data and is poorly controlled, stored and managed on file shares, on personal devices and in the cloud.
  • Organizations have little awareness of the volume, composition, risk and business value of their unstructured data.
  • Instead of addressing the holistic picture of unstructured data, including content, data access and data storage, IT leaders tend to view unstructured data only from the perspective of age, and do little if anything to support information governance.

Recommendations

  • Organizations should review the scope of their unstructured data problems by using file analysis (FA) tools to understand where dark unstructured data resides and who has access to it.
  • Identify the value and risks of unstructured data, and prioritize unstructured data management needs for classification and information governance, file and identity governance, storage management and content migration.
  • Delete redundant or unneeded data once unstructured data is classified and mapped, then move legal, regulatory and stale data for compliance or low-touch retention reasons to lower-cost storage, and assign policies for retention and access.

Table of Contents

Analysis

Innovation Description/Definition

FA differs from traditional storage reporting tools not only by reporting on simple file attributes, but also by providing detailed metadata and contextual information to enable better information governance and storage management actions. These tools analyze, index, search, track and report on file metadata and, in some cases, file content, to assist in taking action on files according to what was collected.
FA tools offer a variety of options, for example:
  • Storage management FA tools focus on the frequency of unstructured data use, identifying data associated with different applications and taking action on that data, such as migration to an archive or a tiered storage layer, or to be deleted.
  • File and identity governance tools focus on who has access to which files and can identify and correct anomalies directly through the tools or through integration with Active Directory.
  • Another class of FA tools provides a full content index, and is used for classification and information governance. These tools focus on what actions to take on unstructured data for information governance, e-discovery (such as legal hold), archiving, defensible deletion and storage management.

Business Impact

FA provides business value in the following ways:
  • Reducing risk by identifying which files reside where and who has access to them, allowing remediation on areas such as eliminating personally identifiable information, corralling and controlling intellectual property, and finding and eliminating redundant and outdated data that may lead to business difficulties, such as multiple copies of a contract
  • Reducing cost by reducing the amount of data stored
  • Classifying valuable business data so that it can be more easily found and leveraged
  • Supporting e-discovery efforts for legal and regulatory investigations
Unstructured data is growing at a much faster pace than traditional relational database management system (RDBMS) data, now accounting for well over half of all data storage by organizations and presenting a major challenge to manage. This data resides in file shares, email, SharePoint, file sync and share (FSS) applications, and individuals' laptops and desktops. Organizations are better equipped to take action when data access, usage, associations, redundancy and content are fully understood. Identifying the users and groups with access to data, matching them to who should or shouldn't have access and recognizing anomalies reduces security risks and increases organizational effectiveness. Understanding data's use and its associations with applications can identify the data to be moved to lower-cost storage or to be deleted. Going beyond the metadata and understanding the content of dark data (data gathered by companies that is not part of their day-to-day operations; see Note 1) can provide even more value as organizations initiate information governance strategies.
FA improves e-discovery readiness through searching, indexing and categorizing unstructured data that can be fed into archiving, enterprise content management (ECM) and e-discovery tools.
FA tools enable IT to create a visualization of unstructured data that can be presented to others in the organization so that they can make decisions based on the data. Key to this process is the creation of an effective cross-functional team of IT, lines of business (content experts), legal and compliance stakeholders that work together to use the data generated from the FA to make better information governance decisions.
FA tools enable views into an organization's unstructured data, much as master data management (MDM) does for structured data. As organizations visualize the content of their unstructured data, the use cases will move beyond storage management and governance into business support.
Use cases for FA include:
  • Classifications for information security purposes
  • Enforcement of information governance and retention policies
  • Support for archiving/e-discovery and business reporting
  • Storage management
  • Data center or server consolidation
  • Cloud migration
  • Support for management of data as a result of mergers or acquisitions
  • Data deletion/legacy data cleanup
  • Copy data management
Examples of specific use case scenarios:
  • Organization: Manufacturing Company:
    • Use Case: Storage management
    • Objective: Cleanse a file share environment that contained 30TB of file system data.
    • Implementation: Initially delayed because of the newness of the FA approach internally. Once permissions were received, the file discovery and analysis project took less than three months to complete.
    • Outcome: A total of 50% more content was identified beyond the original 30TB. After analysis, almost 60% of the data was identified for removal. As a result, the CIO authorized policies for the deletion of the data (currently being implemented). The ROI (payback) is two years, not including the resultant cost avoidance deferral of the storage hardware purchase.
    • Buyer: CIO and storage team
  • Organization: Oil and Gas Company:
    • Use Case: Migration to SharePoint
    • Objective: Clean up many sites worldwide that had unknown tens of terabytes of unstructured data prior to migration to SharePoint. Remove sensitive data, get a document countdown and provide good-quality data.
    • Implementation: The implementations and initial cleansing at all sites worldwide were completed in one year. Massive savings were realized, as the tool identified more than 30% of data that could be removed prior to the migration. The FA product generated metadata about the files to be tagged, and to assist in reorganizing the storage. This information was passed on to a migration tool. The project is still running and is being funded with new success factors focused on improving business user engagement.
    • Outcome: The FA tool reduced the time and costs for migration, and provided metadata tags that could not have been practically generated by manual processes.
    • Buyer: CTO
  • Organization: Financial Services:
    • Use Case: Reporting
    • Objective: The organization had previously deployed another tool and had achieved limited success without delivering to full expectations. While storage savings was a factor, the overall drivers weren't 100% clear. However, one long-term objective was to add metadata prior to migration to SharePoint.
    • Implementation: During the six-week project, the tool identified 100TB of data — of which only 35TB were unique. Of the 35TB, the FA tool identified 15TB for removal.
    • Outcome: At the onset, there was data everywhere that was being poorly managed. The storage team was able to identify the potential to go from 100TB to 20TB of necessary data.
    • Buyer: CIO and storage team
As organizations implement FA tools to assist in general information governance activities, more use cases will become apparent. The impact of understanding and taking action on unstructured data will be greatest on organizations that generate millions or billions of files from many applications. The potential for a high payback will help drive the adoption of these tools (see Figure 1).
Figure 1. Innovation Window for File Analysis
Figure 1.Innovation Window for File Analysis
Source: Gartner (March 2013)

IT Impact

The impact of FA tools on IT can be dramatic. Storage administrators now have a tool that shows detailed information about the data being stored to take to business owners so that more-informed decisions can be made on data retention and optimized data protection policies. File shares can be dramatically cleaned up by deleting old, orphaned and irrelevant data, greatly reducing the burden on IT when an e-discovery, regulatory or compliance request is presented. Data generated by FA tools can be integrated with data loss prevention (DLP) tools to provide proactive management of intellectual property.

Adoption Rate

Gartner considers FA to be a high-impact technology, and estimates that it will take two to five years before it reaches mainstream adoption. Adoption rates will differ according to use cases. FA for storage management purposes, namely for migrations or technology refreshes, may evolve more quickly as organizations view massive amounts of data stored on file shares as cumbersome to move in totality.
FA for classification, governance and e-discovery will increase in frequency and importance as organizations ascertain the legal, compliance and intellectual property loss potential around their unknown unstructured data and associated costs to manage.
Figure 2 shows the responses of organizations at the December 2012 Data Center Conference in Las Vegas to the question, "Do you have management tools in place to help better understand your unstructured data?"
Figure 2. Organizations With Management Tools in Place to Better Understand Unstructured Data
Figure 2.Organizations With Management Tools in Place to Better Understand Unstructured Data
N = 52
Source: Gartner (March 2013)
Figure 3 shows the responses of organizations at the December 2012 Data Center Conference in Las Vegas to the question, "What type of aging data represents your biggest challenge?"
Figure 3. Organizations' Aging Data Challenges
Figure 3.Organizations' Aging Data Challenges
N = 52
Source: Gartner (March 2013)

Risks

The main challenge organizations face in adopting FA is finally facing the black hole of data they have ignored for too long. Some organizations have literally said they are afraid of what they might find.
Yet, FA technology is relatively risk-free, as the main outcomes of data scans are data reports and visualizations. Based on these, organizations can take action on segments of the data. Risk arises as a result of poorly defined policies on what to do with the data once it's classified, and/or the improper movement of the data in response to the classification. For example, if an organization runs a report on access times for documents and then deletes everything that has not been touched in three years, issues can arise if regulations require the organization to keep some of the data longer. Legal problems also may arise if the data is moved from one repository to another and the chain of custody is not maintained. While FA tools may have a slight impact on system performance, most are configured to run at a low rate of impact on CPUs, or to run during idle periods.

Key Technology and Service Providers

Technology providers with FA capabilities have varying backgrounds, including storage management, e-discovery, indexing and FA, which may be the providers' primary product areas. The providers offer at least one of the following capabilities for either file metadata or content reporting: storage management, file/identity governance, classification/information governance and content migration. Sample vendors include Acaveo, Active Navigation, Aptare, Autonomy (an HP company), AvePoint, Clearswift, Content Analyst, dataglobal, Dell-Quest Software, EMC, Equivio, FileTek, IBM-Stored IQ, Idera, Imperva, Index Engines, Litera, Metalogix, Northern, NTP Software, Nuix, Proofpoint, Recommind, RSD, Symantec, Tarmin, Varonis Systems and ZyLAB.

Data Insight 4.0 Lights Up Dark Data Putting Organizations in Control of their Unstructured Data

Data Insight 4.0 Lights Up Dark Data Putting Organizations in Control of their Unstructured Data

| | Leave a comment
It is no secret that almost every organization regardless of its size has growing amounts of unstructured data that reside almost everywhere. The BIG unknown is what useful information, if any, these data repositories contain and what value, cost or risk they present. Using Symantec Data Insight 4.0, organizations can better understand the data that resides within their Dark Data repositories, the context in which it is being used, and then take informed actions to better manage and secure this data.

The Era of Dark Data

A decade of unchecked unstructured data growth is taking its toll on organizations. Technologies such as archiving, deduplication, scale-out storage systems and even tape have resulted in organizations storing hundreds of terabytes if not petabytes of data. This has created an even bigger issue: they are in the dark as to what data they have.

This problem promises to only get worse. Gartner finds that unstructured data is growing at a faster pace than relational databases and already accounts for over half of all data storage. Organizations continuously collect and store more unstructured data in email PST files as well as on file servers and SharePoint repositories.

Particularly unnerving to organizations is their inability to fully discern the nature of this data. As they store it, they lack meaningful insight into the data's context. Some of the data may be valuable. Some of it may simply take up space and need to be deleted. In still other cases the data may be unnecessarily exposed and improperly accessed. If organizations are to glean the value of this data as well as effectively manage and secure their data stores, they need to:

  • Identify what the data is
  • Analyze what relevance if any it has to the organization
  • Take the appropriate course of action whether that be archiving, deleting or securing the data
Data Insight 4.0 Sheds Light on Dark Data's Context

Symantec Data Insight 4.0 provides the tool that organizations need to first understand the context in which data in their Dark Data repositories is being created, used and shared. Using Data Insight 4.0, organizations can establish:

  • What data is being stored and where
  • Who has access to it
  • How it is being accessed and used
  • Who owns the data
Having this knowledge helps organizations understand their unstructured data stores and enables them to put in place the people and processes necessary for effective data governance. Data Insight also tracks application access and user activity to data over time so they can understand how data in their Dark Data repositories is being accessed, how frequently it is accessed and in what context.

To establish which applications and/or users are accessing data, Data Insight integrates with Microsoft Active Directory (AD), LDAP and NIS/NIS+ to monitor, record and report on exactly who or what is accessing data in these Dark Data repositories. Once it captures these data access and usage patterns, the current or future value of this data as well as the risks associated by their access to this data becomes more apparent.

For instance, an organization may conclude that the stored Dark Data offers little or no value, presents no risk and may be either archived or deleted. On the other hand, they may discover that questionable or unauthorized access to some of the Dark Data is occurring.

Organizations can also leverage Data Insight 4.0's improved integration with Symantec Data Loss Prevention (DLP) to better assess and remedy a situation where access to sensitive data is occurring. DLP first examines the content of files in Dark Data repositories to determine which ones contain sensitive data (social security numbers, account numbers, credit card numbers, etc.) Once DLP completes this assessment, Data Insight 4.0 through its new integration with DLP directly sends notifications to administrators with instructions on how to correct these data exposures so the organization can better protect itself from unauthorized data access.

Dark Data Analysis Drives Remediation


This is only example of how Data Insight 4.0 equips organizations with the information and tools they need to remediate security deficiencies. The first step many organizations will take when utilizing Data Insight 4.0 is to simply identify who or what department owns the data. Changes in corporate structures (employees change jobs, get promoted, leave the company, etc.) coupled with the age of the data itself can make it unclear as to who owns the data. Data Insight's inferred data ownership analysis helps organizations quickly identify and engage data owners.

The next step is regaining control of access permissions. Access permissions to data of existing Dark Data repositories may be no longer relevant or have become excessive over time. Data Insight 4.0 now arms organizations with the information they need to align data access to their real world business need. By using Data Insight to document the data's effective permissions along with who is accessing the data, an organization can determine whether or not this access is warranted.

Should access to the data need to change, organizations may then leverage Data Insight's access history and "What if" analysis to determine the impact of the change thus eliminating the risk of making the change. Organizations may also use Data Insight to monitor and detect unauthorized activity that either violates policy or arises from permissions inconsistencies. By combining Data Insight's analysis with DLP, organizations may prioritize securing access to their most critical data.

During the process to secure access to data, organizations will often find that they have large amounts of data that is either not being used, is orphan or is not valid business data. Having established the data's relevance or lack thereof, Data Insight also now integrates with Symantec Enterprise Vault so organizations may take action on that data directly from within Data Insight.

Using the Data Insight management console, organizations may select what data they want to remediate and then archive the content into Enterprise Vault. Organizations can further understand the data owners and the context of the data use to determine data retention periods. Knowing exactly what data has been accessed and by who becomes extremely helpful as organizations build a legal defense.

Understanding which data is active and stale also helps organizations optimize what storage tiers they should use for their Dark Data repositories. Data Insight provides a remediation framework that gives organizations the flexibility to implement custom actions such as disposition or migration.

Data Insight 4.0 Takes Control of Dark Data
Data Insight 4.0 helps organizations take control of their Dark Data with new discovery, analysis and remediation capabilities. The interactive contextual navigation of the data and the flexible query interface shed light on Dark Data. Advanced analysis capabilities and "What if" modeling help more easily and effectively put Dark Data in its place. Data Insight 4 monitors file share and SharePoint repositories and provides the actionable intelligence that organizations need to control costs and risk as well as realize the value of their unstructured data.

Data Insight's new remediation framework enables organizations to put in motion the steps needed to restrict and/or remove access to data through its integration with DLP or even archive Dark Data using Enterprise Vault. This gives organizations new flexibility to implement custom actions so should they determine data poses a risk, has no business value and no longer needs to be retained, they may confidently move ahead with performing the right action on the data.

Equally notably, as organizations think more strategically about their overall data management strategy, Data Insight falls nicely in line with Symantec's publicly stated goal to deliver a more cohesive set of software. This release more closely brings together Data Insight, Data Loss Prevention and Enterprise Vault reflects this renewed emphasis within Symantec and helps position organizations to centrally manage their data.

Organizations no longer need to feel in the dark about the data contained in their burgeoning unstructured data stores. Using Data Insight 4 they can start to put an end to the era of Dark Data that many find themselves in and replace it with a new era of enlightenment that puts them firmly in control of their data.

Monday, August 5, 2013

For Russia, a $13B Price Tag to Beat Brazil in Mobile


For Russia, a $13B Price Tag to Beat Brazil in Mobile


Andrey Rudakov/Bloomberg
A mobile phone user in front of a photographic panel of the Peter and Paul fortress in St. Petersburg, Russia on June 20, 2013. 
 
It's a big country with a big problem.

Russia, the world's largest nation by land mass, faces an enormous logistical challenge in building wireless systems that can deliver mobile data service to all 143 million residents.

The mobile speed there was just 0.15 megabit per second last year, compared with 4.53 megabits for Canada, according to a study by Cisco Systems. No wonder just 10 percent of handsets in Russia were smartphones.

Those numbers place Russia ahead of only Indonesia and India in Cisco's mobile rankings of the 20 speediest countries. But that low standing is now translating into a buying boom in networking equipment in Russia. As Bloomberg News reported Monday, Russian wireless carriers OAO Mobile TeleSystems, OAO MegaFon, VimpelCom and OAO Rostelecom have committed to spend 420 billion rubles ($12.9 billion) on faster networks by 2019.

No doubt, the fourth-generation networks will improve the quality of mobile service. But it may barely move the needle on Russia's global ranking.

While Russia's percentage of smartphone users is projected to triple to 30 percent of all handsets by 2017, the country's ranking is expected to remain the same. And while mobile speeds are expected to reach 2.55 megabits per second, about 17 times faster than in 2012, Cisco's report has the nation only surpassing two more countries -- Argentina and Brazil.

As Russian operators commit to big investments in the country's mobile infrastructure, the rest of the world is hardly standing still. In South Korea and the U.S., smartphones are projected to make up nearly 100 percent of all handsets in four years, and mobile speeds are seen surpassing 17 and 14 megabits per second, respectively, according to Cisco.

Thursday, August 1, 2013

Yahoo’s Mayer to Rebuild Research Group With 50 PhD Hires

Yahoo’s Mayer to Rebuild Research Group With 50 PhD Hires


Yahoo! Inc. (YHOO)’s Marissa Mayer is boosting the company’s research unit, which was downsized under her predecessor, as the chief executive officer bets on emerging technologies from big data to artificial intelligence.

Yahoo Labs has hired 30 researchers with PhDs in 2013 and plans to add another 20 by year-end, Mayer said in an interview at the company’s Sunnyvale, California headquarters last week. The group is led by Chief Scientist Ron Brachman, a former scientist at the U.S. agency that helped invent the Internet.

In addition to trying to revive Yahoo through acquisitions and a focus on mobile, Mayer is investing in new projects after four straight years of reduced spending on research and development. Yahoo Labs, set up in 2005 as an incubator for academic-style research and bold experimentation, suffered cuts last year during the brief tenure of former CEO Scott Thompson, leading to the departure of group founder and leader Prabhakar Raghavan to Google Inc. (GOOG)
 
“The lab is still here -- it’s been reduced in size,” Mayer said. The company is investing “heavily to build it back up,” she said

Job openings listed on Yahoo’s website include a research scientist specializing in mobile, a senior principal scientist in personalization and a research scientist in pricing and marketplaces.

Brachman, who helped build Yahoo’s research group when he joined the company in 2005, previously spent three years at the U.S. government’s Defense Advanced Research Projects Agency (Darpa), which helped create the Internet in the 1960s. Before that, he led research on artificial intelligence at AT&T Inc.’s Labs.

R&D Spending

Some of Yahoo Labs’ focus areas are in mobile, content personalization and predictive analytics. Recent projects include a search engine that asks users for more context about their queries and an analysis of political opinions drawn from messages posted to Twitter Inc.

Yahoo spent $885.82 million last year on product development, which includes R&D, a 27 percent decline from 2008. As a percentage of sales, Yahoo budgeted 18 percent to product development last year, higher than Google’s 14 percent spent on R&D and lower than Facebook Inc. (FB)’s 27 percent.

Talent Search

The recruiting boost reflects Mayer’s broader effort to attract top Silicon Valley talent. She has spent more than $1.2 billion on a startup takeover spree that has netted Tumblr Inc. founder David Karp and Nick D’Aloisio, the whiz-kid teenager who founded news reading app Summly. Two former Yahoo executives, Jeff Bonforte and Amit Kumar, rejoined the company after Mayer purchased their respective startups, Xobni Corp. and Palaran Inc., last month.

The CEO has also worked to put engineers back at the center of the largest U.S. Web portal. Yahoo’s technology council, a governing body of eight leaders that includes co-founder David Filo and Chief Architect Amotz Maimon, is critical in the approval of new products.

“If I don’t sign off and say it’s excellent from a product standpoint, and if David Filo or Amotz don’t sign off and say it’s excellent from tech-council standpoint, it doesn’t happen,” Mayer said.

Yahoo fell less than 1 percent to $27.96 at the close in New York, leaving the stock up 75 percent in the past year.

To contact the reporters on this story: Douglas MacMillan in San Francisco at dmacmillan3@bloomberg.net; Brad Stone in San Francisco at bstone12@bloomberg.net
 
To contact the editor responsible for this story: Pui-Wing Tam at ptam13@bloomberg.net

Bloomberg: The Public-Private Surveillance Partnership

Public and Private Surveillance
Illustration by Martin Cole

The Public-Private Surveillance Partnership


Imagine the government passed a law requiring all citizens to carry a tracking device. Such a law would immediately be found unconstitutional. Yet we all carry mobile phones.

If the National Security Agency required us to notify it whenever we made a new friend, the nation would rebel. Yet we notify Facebook Inc. (FB) If the Federal Bureau of Investigation demanded copies of all our conversations and correspondence, it would be laughed at. Yet we provide copies of our e-mail to Google Inc. (GOOG), Microsoft Corp. (MSFT) or whoever our mail host is; we provide copies of our text messages to Verizon Communications Inc. (VZ), AT&T Inc. (T) and Sprint Corp. (S); and we provide copies of other conversations to Twitter Inc., Facebook, LinkedIn (LNKD) Corp. or whatever other site is hosting them.

The primary business model of the Internet is built on mass surveillance, and our government’s intelligence-gathering agencies have become addicted to that data. Understanding how we got here is critical to understanding how we undo the damage.

Computers and networks inherently produce data, and our constant interactions with them allow corporations to collect an enormous amount of intensely personal data about us as we go about our daily lives. Sometimes we produce this data inadvertently simply by using our phones, credit cards, computers and other devices. Sometimes we give corporations this data directly on Google, Facebook, Apple Inc.’s iCloud and so on in exchange for whatever free or cheap service we receive from the Internet in return.

The NSA is also in the business of spying on everyone, and it has realized it’s far easier to collect all the data from these corporations rather than from us directly. In some cases, the NSA asks for this data nicely. In other cases, it makes use of subtle threats or overt pressure. If that doesn’t work, it uses tools like national security letters.

The Partnership

The result is a corporate-government surveillance partnership, one that allows both the government and corporations to get away with things they couldn’t otherwise.

There are two types of laws in the U.S., each designed to constrain a different type of power: constitutional law, which places limitations on government, and regulatory law, which constrains corporations. Historically, these two areas have largely remained separate, but today each group has learned how to use the other’s laws to bypass their own restrictions. The government uses corporations to get around its limits, and corporations use the government to get around their limits.

This partnership manifests itself in various ways. The government uses corporations to circumvent its prohibitions against eavesdropping domestically on its citizens. Corporations rely on the government to ensure that they have unfettered use of the data they collect.

Here’s an example: It would be reasonable for our government to debate the circumstances under which corporations can collect and use our data, and to provide for protections against misuse. But if the government is using that very data for its own surveillance purposes, it has an incentive to oppose any laws to limit data collection. And because corporations see no need to give consumers any choice in this matter -- because it would only reduce their profits -- the market isn’t going to protect consumers, either.

Our elected officials are often supported, endorsed and funded by these corporations as well, setting up an incestuous relationship between corporations, lawmakers and the intelligence community.

The losers are us, the people, who are left with no one to stand up for our interests. Our elected government, which is supposed to be responsible to us, is not. And corporations, which in a market economy are supposed to be responsive to our needs, are not. What we have now is death to privacy -- and that’s very dangerous to democracy and liberty.

Challenging Power

The simple answer is to blame consumers, who shouldn’t use mobile phones, credit cards, banks or the Internet if they don’t want to be tracked. But that argument deliberately ignores the reality of today’s world. Everything we do involves computers, even if we’re not using them directly. And by their nature, computers produce tracking data. We can’t go back to a world where we don’t use computers, the Internet or social networking. We have no choice but to share our personal information with these corporations, because that’s how our world works today.

Curbing the power of the corporate-private surveillance partnership requires limitations on both what corporations can do with the data we choose to give them and restrictions on how and when the government can demand access to that data. Because both of these changes go against the interests of corporations and the government, we have to demand them as citizens and voters. We can lobby our government to operate more transparently -- disclosing the opinions of the Foreign Intelligence Surveillance Court would be a good start -- and hold our lawmakers accountable when it doesn’t. But it’s not going to be easy. There are strong interests doing their best to ensure that the steady stream of data keeps flowing.

(Bruce Schneier is a computer security technologist. He is the author of several books, including his latest, “Liars and Outliers: Enabling the Trust Society Needs to Thrive.”)

To contact the writer of this article: Bruce Schneier at schneier@schneier.com.

To contact the editor responsible for this article: Alex Bruns at abruns@bloomberg.net.

Location Analytics: Doing It Like Bond, James Bond

07/31/2013

Location Analytics: Doing It Like Bond, James Bond

Bond is lost, camping out in a bunker underneath a volcano 150 km outside Petropavlovsk, in northwest Siberia. It’s been three months since he was sent to investigate the interests of Spectral Corporation, the largest wheat producers east of the Urals.
Shivering from the cold, he stares at a computer screen showing a montage of overlapping spreadsheets, various visual interpretations of grain production data, a heat map illustrating the top production zones, and planning permission documents from the Russian government.
Having clearly identified what he was sent to find – Bond quickly shuts the computer and places a call to M, informing her that the mission is complete and that he’s on his way home.
map1 300x183 Location Analytics: Doing It Like Bond, James Bond
This modern day interpretation of how we gather and analyze data is something we can all innately understand, regardless of our generation. A movie director knows that overlaying data on a map is a great visual shortcut for the audience.
Whether you use a plain old paper map or a sophisticated piece of analytics software, you gain access to a perspective that only the geo-context can provide.
In Bond, the maps have blinking graphs, flashing lights, as well as multiple forms of visual analysis. The maps can drill down to a hut in the Siberian wasteland and in a few Nano seconds they can calculate automatically how long it will take a foot soldier to march to the hut from Vladivostok. It looks complex, but we intuitively understand what we are looking at – no longer does this type of analysis seem futuristic. And the reality is that it’s not.
So why then doesn’t life look more like a James Bond movie (a subject I’m tempted to explore on several levels, but let’s stick to the technology for now)? We may not have all the high-tech gadgets or capabilities depicted in the films, but access to intelligent and interactive software is increasingly accepted and expected. Let’s face it, it’s become critical to maintaining a competitive advantage.
I’m struck by an image circa 1970s-’80s of hordes of gray people in gray suits visit their gray offices, spending countless hours exploring (and trying to understand) mountains of business data – the image is fading fast.
The reality is that the mundane and manual exercise of bringing piles of data together in a way that provides insight and leads to intelligent conclusions has evolved considerably in the past few decades. It is very quickly becoming highly sophisticated, instantaneous and all-the-more interactive – not only across data sources but the business itself.
As a result, data analysis is increasingly becoming a priority function within many organizations playing a key role in:
  • Driving strategy
  • Informing business decisions throughout
  • Identifying high-risk scenarios
  • Uncovering opportunities
  • Providing a safe environment for testing hypothetical business scenarios
If we were directing the movie “The Life of our Business” we would use maps – maps of our existing and potential customers, demographic segmentations and densities, maps of our locations and our supply-chain logistics, competitor location and performance etc. We would highlight breakdowns in the factory, log jams in the packing area or hot spots in our retail stores on maps. In short, maps would have a starring role.
With 80% of available business data having a geographical location associated with it – it only makes sense that we leverage the location context of the information available to us. Furthermore, we understand the physical world much faster and more comprehensively through what we see. And for this reason alone, using geo-visual representations of data has a key advantage over any other way of representing data, period.
Show me a map and how my data interacts in space and time and in relation to multiple types of data and I will understand. Show me a fancy infographic or numerous spreadsheets and I will show you the beginnings of a migraine.
Context is Critical
Untitled 300x204 Location Analytics: Doing It Like Bond, James Bond
As the map becomes the background onto which all other forms of analysis are overlaid and accessed, the big picture comes increasingly into view. Increasingly interactive analysis, including geo-contextualiztion, opens the door to a much deeper and comprehensive understanding of your market and business potential – in short, you can now have access to an intelligent “atlas” for your business, helping you to better chart your way forward.
In this big data world we may have to accept that our ability to analyze our business grows at a slower pace than the pace at which the data is flowing in, but we don’t have to accept our limitations in leveraging this wealth of information or go it alone. Benefiting from a geo-visual representation of our data is one sure way to speed up our understanding and reaction time.
Visualization is Key
Untitled2 300x179 Location Analytics: Doing It Like Bond, James Bond
Imagine, you are the villain in search of Bond. With the right analytics platform at your fingertips – including the option for geo-visualization and location analytics – you might quickly conclude that the first place to look for Bond would be beneath a volcano. But a map showing all the villains’ lairs across the globe that served as hiding places for Bond, the current weather forecast, road conditions and where your own intelligence officers are stationed, would make that much more obvious and the search for him that much more efficient.

3 Steps for Manufacturers to Unlock the Value of Big Data

08/01/2013

3 Steps for Manufacturers to Unlock the Value of Big Data

Manufacturers are awash in data. But too often it’s trapped in data silos, and it can’t be leveraged to help organizations compete in an increasingly complex market landscape.

manufacturer 3 Steps for Manufacturers to Unlock the Value of Big Data

Manufacturers can use data as a key currency to unlock value to drive better efficiency and productivity, according to a recent research report from Aberdeen Research.

But they must take three key steps to leverage data to fuel the potential boost to the bottom line:
1. Study data management opportunities and challenges
2. Pinpoint data management capabilities
3. Prioritize data analysis initiatives


When tackling the challenges and opportunities presented by data, leading companies are 89% more likely than followers to see the need to unlock hidden information from big data rather than just controlling large data sets, according to Aberdeen.

“For example, possible supply chain interruption can be found in a supplier’s performance management data, the same way that downtime due to equipment age or corrosion is hidden in asset performance management data,” the report notes. “Additionally, data on non-conformance can help predict critical issues like loss of productivity and recalls.”

This highlights the increasing importance of data analysis to help manufacturers access and act on hidden data.

Seven out of 10 companies in the study rely on dashboards and automatic reporting; however, leading companies are 25% more likely than followers to prioritize investments in analytics to support visual discovery, the report notes.

“Cloud and big data technologies help aggregate data sets across disparate functions to overcome data silos,” according to the report. “Predictive analysis and attention to unstructured data, such as behaviors, helps identify emerging issues. Additionally, manufacturing companies can make a difference by identifying where they can get the most payback for their improvement efforts.”

During the second step of unlocking actionable insight from data, leading companies understand that a data-driven culture isn’t a competition between IT and business users.

Leaders see IT’s job as managing and maintaining a sustainable data infrastructure. Moreover, leaders are 97% more likely than followers to assign importance to IT’s role in data quality and integrity, the report notes.

“Leaders see managers’ and operators’ jobs as managing business opportunities,” according to Aberdeen. “They provide context for how operations can take action against metrics and information.”

Leading companies are 35% more likely than followers to provide users with proactive, problem-solving solutions they can use themselves to react to changes in metrics.

Finally, to be effective, manufacturers must align data analysis initiatives with the overarching business performance goals.

When prioritizing data initiatives, leading companies are:
  • 34% more likely than followers to integrate data systems to support decisions
  • 70% more likely than laggards to optimize processes when best practices are identified
  • 54% more likely to define best practices within a data-driven framework
  • 45% more likely to use big data and analytics to combine manufacturing data and to support the enterprise platform
  • 41% more likely to train business users in data analysis and 26% more likely to embed analytics in process monitoring and dashboards
  • 27% more likely than followers to increase operational awareness of risk, including by using predictive analytics to provide early warning of critical issues before they evolve to operational failure
“Unlocking the value of data is more than an idea – it is a ‘must have’ component of corporate information strategy,” the report concludes. “By complementing perception, intuition or opinions with facts, manufacturers encourage feedback, questions that clarify strategies and employee participation. When managed effectively, manufacturing data can help companies grow and support the vision for a knowledgeable and more effective organization.”

FORBES: Are You Tangled In A Big Data Hairball?

Lisa Arthur
Lisa Arthur, Contributor
I write about how data & data-driven marketing are changing business.
8/01/2013 @ 7:15AM |

Are You Tangled In A Big Data Hairball?


Tangled fishing line

I know, I know . . . Hairballs are disgusting, and years ago, I never would have dreamed of associating something so repulsive with my chosen profession, marketing. But that was before – before marketers had to manage an ever-expanding array of channels and processes, before we had all kinds of data bombarding us non-stop, before we had to dig through countless treasure troves of information to improve the customer experience. Now all of these things, when left unchecked, contribute to an enormously complex mess I like to call “the data hairball” – and more and more marketers are challenged by it every day.
What exactly IS the data hairball?
Metaphorically speaking I see the data hairball as the biggest obstacle to improving customer engagement. It is the complicated jumble of interactions, applications, data and processes that accumulate haphazardly when companies are unprepared to handle information from a wide range of sources.  More than the “data deluge” or the “sea of data” you’ve all read about, extending those notions, the data hairball would be the shoreline after a tsunami, but prior to reconstruction.

To me, the data hairball embodies both the promise and the threat behind big data and digital channels, and whenever I mention it to a roomful of marketers, I sense immediate recognition.

Heads start nodding in agreement. Nervous smiles appear. Some people shuffle their feet as if they could sidestep the very thought of it. Audiences know exactly what I’m talking about when I use the term.
But, that doesn’t surprise me.

After all, marketers are the ones on the front lines, battling with the chaos of traditional and digital information that’s now piling up 24/7. We’re the ones who recognize the colossal complexity of the situation. We’ve all felt the knot of anxiety in our stomachs when we’ve been called into the C-suite to present strategies that often lack the supporting data we know we need to make a compelling case.

While I was working on my book this spring, Jeffrey Hayzlett, the former CMO of Kodak who now serves as an advisor to other CMOs and CEOs, admitted to me that he knew the data hairball all too well and that he had struggled with it at Kodak.

“I was coughing up the data hairball every day,” Hayzlett told me. “At the time, Kodak had unique lines of business focused on their markets, printers, cameras— just to name a couple.  Each of those divisions had siloed information they simply weren’t sharing effectively across the enterprise. 

All I wanted to do was answer the following simple question, ‘What are the names of the 1,500 customers who purchased one of our high-value printers?’”

Then he laughed.

“If someone asked me to produce that list with 24 hour notice or else they’d kill my children, I’d be childless today,” Hayzlett said. “I couldn’t have come up with those names. The systems were broken, even though the data did exist.”

That’s the data hairball.

Over the past few weeks, I’ve discussed why the C-suite is feeling more and more like a goat rodeo and how outdated processes are preventing companies from realizing the true value of data-driven marketing. Now that I’ve defined the data hairball, I’ll explore how you can start unraveling it to leverage the big data insights you need to optimize all aspects of your marketing and customer experience.
The good news?  It’s all manageable.  But as we all know, no journey can begin without taking those first few strategic steps.

Four Ways Business Analytics Tools Can Be Improved

Young Entrepreneur Council
We advise the world's most promising young professionals.
7/31/2013 @ 9:00AM |

Microsoft Dynamics SL Business Analytics
(Photo credit: Wikipedia)

Peter Drucker famously said, “If you can’t measure it, you can’t manage it.” No industry has benefited from the adoption of this philosophy as much as the analytics industry. But analytics as we know it is about to change completely — and for the better.

As agency co-founders, my partner and I fully believed in this adage and have always looked for the informational advantage to give our clients the edge. Like many others, we quickly realized that current analytics tools are often better at causing paralysis than analysis. The current response to more data availability appears to be flooding an end user with as much data as technologically possible. Yet new tools that educate the user about next steps based on that data are lacking.

Although you wouldn’t know it from the current analytics offerings, we’re at the point in many industries where there is enough accessible data to finally do just that: intake data, synthesize it, apply subject matter knowledge, and output a next step to ensure the user makes optimal choices. We’re happy to lead that charge in the social media marketing realm, but for other industries, here are four things your analytics tools must do to survive the coming big data wave:
  1. Close the loop with the data. As big data becomes available for your industry, don’t take the easy road and simply give users an endless data playpen. Your tool should make them more efficient, not give them an endless rabbit hole in which to get lost. Take on the big problems and find ways to use that data to provide actionable next steps and immediately valuable improvements to their work.
  2. Offer action-based interfaces. The majority of business people are not overly fluent in statistics. Their jobs often require varied and specific non-math skill sets — so your analytics tool shouldn’t require them to learn yet another skill. Remove the burden of statistical know-how from the end user by providing action-based interfaces (“Today, do this” “For tomorrow, make these” etc.). Make these changes and see how elated your clients are. The user looks better to his boss and his boss sees better and more efficient output from the user.
  3. Provide backup. The only thing more aggravating than an analytics tool that increases your workload is one that provides a magical, unsupported recommendation. “Post an article at 5 p.m. on Tuesdays for maximum success” or “Change the color palette to include more orange and yellow” are helpful recommendations … if they’re right. When making a next-gen analytics tool, make sure users can check your logic and understand the reasoning. It helps both in user compliance and client confidence.
  4. Focus on in-time impact. The majority of current tools are phenomenal at reporting what happened last week or last month. Very few focus on what’s happening now and more importantly, on changing what’s happening now. Furthermore, the few that understand the importance of this are going about solving the problem in the wrong ways. They think that by filling their graphs with data more quickly, the user will suddenly know how to change the game as it’s being played. The real impact will come when the creators of these tools stop focusing on how quickly they can get the data to the user, and instead focus on what form the user needs that data in in order to react quickly and accurately. Optimal analytics tools of the future will present the data in an actionable format, rather than presenting the data in a more data-heavy format a few seconds earlier.
The data is out there, and it’s only becoming more accessible. Meanwhile, the analytics market is finally beginning to deliver on its promise to make complicated aspects of business vastly easier to manage. 

I believe the tools that embrace these changes will become the market leaders over the coming years.
If you’re using analytics tools in your business, demand more. If you offer an analytics tool, adapt it. The new wave is coming quickly.

Courtesy of YEC
Brennan White is the founder and CEO of Watchtower, a new social media intelligence software, and founder and Managing Director of leading social media marketing agency, Pandemic Labs. Connect with him on LinkedIn LNKD +3.3%.

Courtesy of YEC

The Young Entrepreneur Council (YEC) is an invite-only organization comprised of the world’s most promising young entrepreneurs. 

In partnership with Citigroup, the YEC recently launched #StartupLab, a free virtual mentorship program that helps millions of entrepreneurs start and grow businesses via live video chats, an expert content library and email lessons.

What Can High-Performance Analytics Do for Me?

On this blog - entry from August 01st 2013 - I will pick on the marketing surrounding the advent of Big Datum to deny a belief that data analysis should be handled by IT depts. or Data Scientists alone.

Business Intelligence should be attached to Sr. Mgmt. as an arm that helps decision makers - I dare say Sr. Mgmt. should be proficient in it and coach Analysts so they become the next generation of executivesin charge of Sales and Marketing functions.

by Pablo Grossi

http://www.sas.com/resources/asset/high-performance-retail-ebook.pdf

What Can High-Performance Analytics Do for Me? 

"Gain better, faster, more profitable insights into every aspect of your business. Explore the wealth of possibilities offered by big data. Answer questions as fast as you can think them up. Make decisions with precision and confidence while your competitors are still running their analyses. All this – and a lower total cost of ownership – is possible with high-performance analytics..."

 The tool has a lot of marketing into it, but it is rather agreeable that there is a lot of truth in what is said, for instance: 

In the e-book (link above), page 15: 

"Williams shared some insights on misconceptions he believes
are rampant in the industry. “There is a belief you have
to go hire statisticians for this type of analysis,” he noted.
“That’s false.” Secondly, he noted, organizations must
eliminate the idea that the analytics team should report to
IT or Operations. “I have cautioned everyone — don’t do
either. Data is going to change
your company but it must be
tied to the merchandising and
marketing teams directly.”..."

It is a mistake to have Business Intelligence segregated into an IT Dept. 

Business tools should be handled by business people, to help them do business better. 

If Executive Development Programs would look into the capable personnel that is kept into cubicles analyzing and crunching numbers - but that could easily be transported into highly productive functions of Front Office environments, those individuals could have an edge over simple sales and marketing professionals who lack analytical skills. 

If data analysis can serve business than let business people do the analysis and the sales should improve as a result, since the marriage of sales skills and data analysis could create the offspring of success.  


Big Data: sete passos iniciais

Big Data: sete passos iniciais 

  • Escrito por  *Marcos Pichatelli
A tendência do Big Data representa a crescente necessidade de processarmos grandes volumes de dados oriundos das mais diversas fontes – texto, mídias sociais, leitores de RFID, imagens, vídeos dentre outros. Então, o que uma companhia deve considerar quando está planejando embarcar no Big Data?

Antes de irmos adiante, aqui vai a minha definição de Big Data: são as tecnologias e práticas emergentes que possibilitam a seleção, processamento, armazenamento e geração de insights de grandes volumes de dados estruturados e não estruturados de maneira rápida, efetiva e a um custo acessível.

O Big Data pode se tornar caro de processar e armazenar se implantado em bancos de dados tradicionais. Para resolver esse problema novas tecnologias usam soluções open source e plataformas de hardware de custo acessível para armazenar os dados de maneira mais eficiente, paralelizar trabalhos e entregar poder de processamento.

Quanto mais os departamentos de TI buscam por alternativas, as discussões se centram no volume, velocidade de processamento e arquitetura das plataformas. Na medida em que a TI amadurece e passa a entender as limitações das tecnologias existentes, muitos CIOs não conseguem articular o valor de negócio dessas soluções alternativas e muito menos como classificar e priorizar os dados. É nesse ponto que entramos na governança de Big Data.

Enquanto as empresas desenvolvem seus casos de negócios, as discussões da plataforma e velocidade se tornam apenas parte da conversa geral sobre a adoção do Big Data. Na realidade, são apenas sete passos necessários para se conseguir o pleno potencial de Big Data:

1.    Coletar: O dado é coletado das fontes de informação e distribuído por meio de múltiplos nós, por exemplo em um arquitetura grid, cada um dos quais processa um subconjunto de dados em paralelo.

2.    Processar: O sistema então usa o mesmo paralelismo gerenciado para ter um desempenho computacional mais rápido em cada nó. Depois, cada nó transforma os resultados das pesquisas em informações mais consumíveis para serem usadas tanto pelos seres humanos (em caso de análise) quando pelas máquinas (em caso de interpretação de resultados em larga escala).

3.    Gerenciar: Geralmente o processamento de Big Data é heterogêneo, originado a partir de diferentes sistemas transacionais. Quase todos os dados precisam ser entendidos, definidos, anotados, limpos e auditados para fins de segurança.

4.    Medir: As análises de negócios devem determinar uma métrica e devem ser acompanhadas constantemente. Geralmente as companhias medem o quanto um dado pode ser integrado/relacionado com um comportamento de consumo ou registro histórico; e como essa integração ou correção aumenta ou diminui com o tempo.

5.    Consumir: O resultado da análise dos dados deve atender a demanda original. Por exemplo, se o resultado for de algumas centenas de terabytes de interações em redes sociais, ele pode demonstrar como seus clientes compram produtos complementares. Então, deve haver regras de como os dados de mídias sociais são acessados e atualizados. O mesmo serve para o acesso de dados máquina-a-máquina (M2M).
6.    Armazenar: Como a tendência “data-as-a-service” ainda toma forma, cada vez mais os dados
permanecem em um único lugar, enquanto os programas de acesso a essas informações se movem. Mesmo que os dados sejam armazenados para o curto prazo de processamento em lote ou para o longo prazo de retenção, as soluções de armazenamento devem ser deliberadamente dirigidas.

7.    Governar: A governança de dados engloba as políticas e fiscalização de informações por meio de uma perspectiva de negócios. Como definido, a governança de dados se aplica a cada um dos seis estágios de entrega de Big Data.

Ao estabelecer processos e princípios de orientação, as sanções de governança passam a girar em torno dos dados. O Big Data necessita ser governado de acordo com seus destinos de consumo, caso contrário, o risco é o desinteresse pelas informações coletadas, para não falar de investimento desnecessário na tecnologia.

A maioria dos early adopters encarregada de pesquisar e adquirir soluções de Big Data focam nos passos de coletar e armazenar em detrimento dos demais. A questão está implícita: “Como reunimos todos esses petabytes de dados e onde os colocamos quando os tivermos?”.

Porém, o processo de definição de requisitos de negócio para o Big Data ainda ilude muitos departamentos de TI. Executivos geralmente veem essa tendência como mais um pretexto para o crescimento do currículo da TI e sem um objetivo claro. Esse ambiente de cinismo mútuo é o único culpado do fato do Big Data nunca ir além da fase inicial.

Como Lorraine Lawson, autora do livro IT Business Edge, afirmou, “a única maneira de assegurar que sua análise será ouvida é ter certeza de que você possui um programa de governança para o Big Data”.

Enraizar processos de governança de dados em nome de um esforço assegura que:
•    O valor do negócio e os resultados desejados sejam claros.
•    Políticas de tratamento de dados chave foram sancionadas.
•    A experiência sobre certo assunto é aplicada aos problemas de Big Data.
•    Definições e regras para dados chave estão claras.
•    Há um processo de escalada para conflitos e questões.
•    Gerenciamento de dados – a execução tática das políticas de governança de dados – é intencional e relevante.
•    Existem direitos de decisão para questões fundamentais durante o desenvolvimento.
•    Os resultados de análise de Big Data são úteis e podem ser colocados em ação.
•    As políticas de privacidade são reforçadas.

Resumindo, a governança de dados significa que a aplicação do Big Data traz resultados de negócios.  É um seguro que garante que as perguntas certas estão sendo feitas. Assim, o poder imenso das novas tecnologias será realmente aproveitado para tornar o armazenamento, processamento e velocidade de entrega mais eficaz e mais ágil do que nunca.

*Marcos Pichatelli é Gerente de Produtos de High-Performance Analytics do SAS e possui mais de 20 anos de experiência em tecnologias de gerenciamento de dados, BI e Analytics.